Delivery, bounces, spam complaints, opens and clicks — tracked per stream, per provider, per tag. See exactly where your mail lands, and why, the moment it gets there.
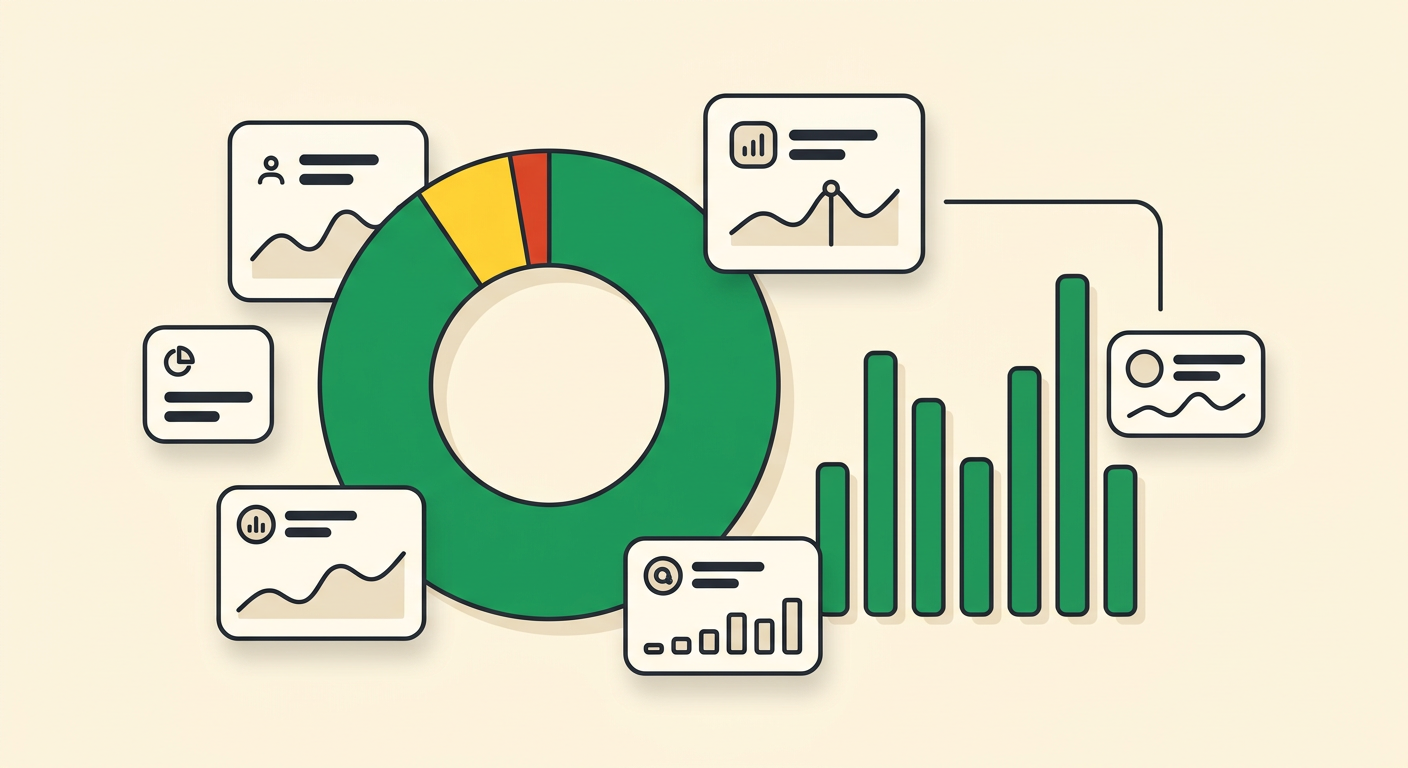
Every message that leaves PostedApi is tracked end to end. Slice the numbers by stream, by recipient provider or by your own tags, and pick any window — from the last hour to the last 45 days.
No config, no BI tool, no SQL. Open the dashboard and see how your streams are doing right now.
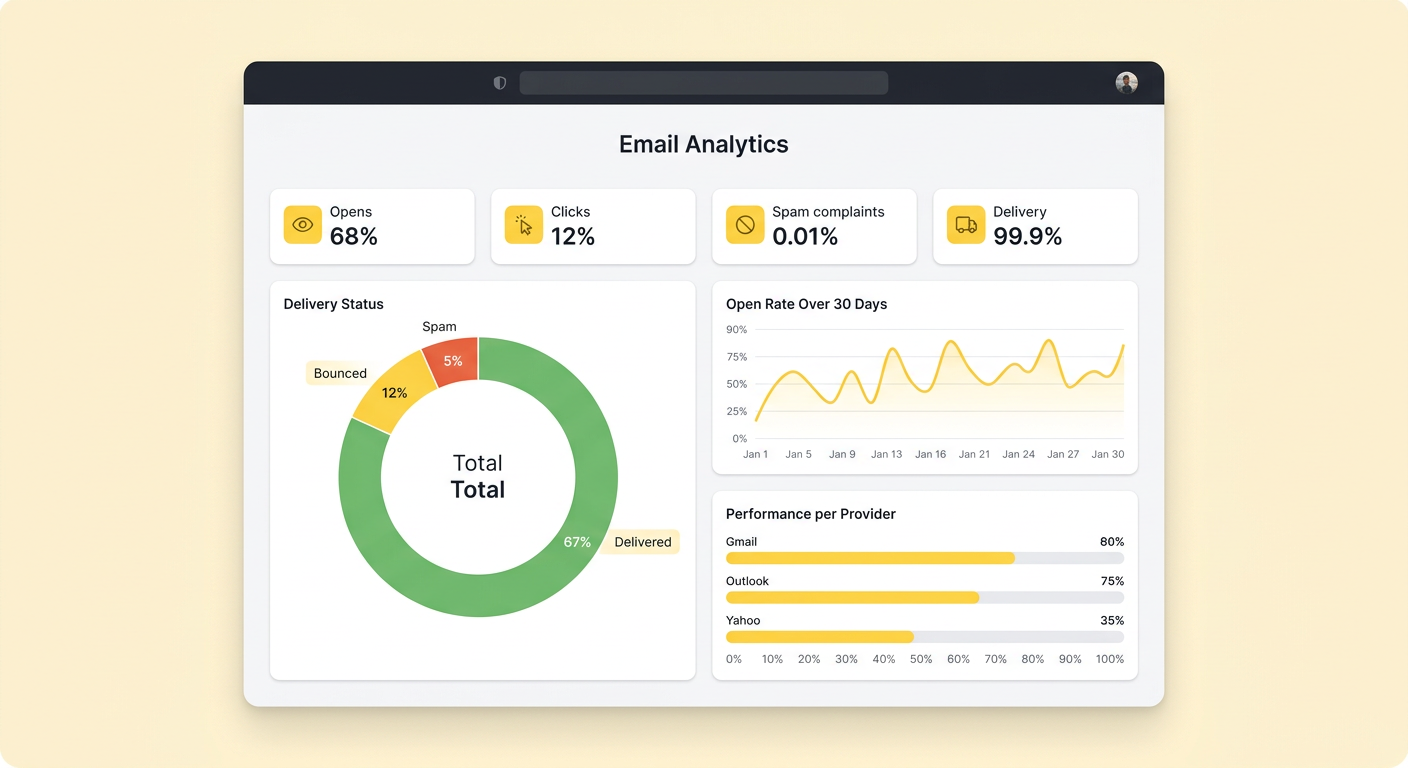
Raw numbers tell you what happened. PostedApi analytics nudge you toward why — and what to fix first.

See how Gmail, Outlook, Yahoo and the long tail of mailbox providers treat your stream — delivery, complaints and delays per provider, not just in aggregate.

Hard bounces, soft bounces and the SMTP reason behind each one, ranked by frequency. Fix the source of the problem instead of guessing at it.

Attach metadata like plan, feature or campaign to any message, then compare delivery side by side. Which plan's receipts bounce most? Now you know.
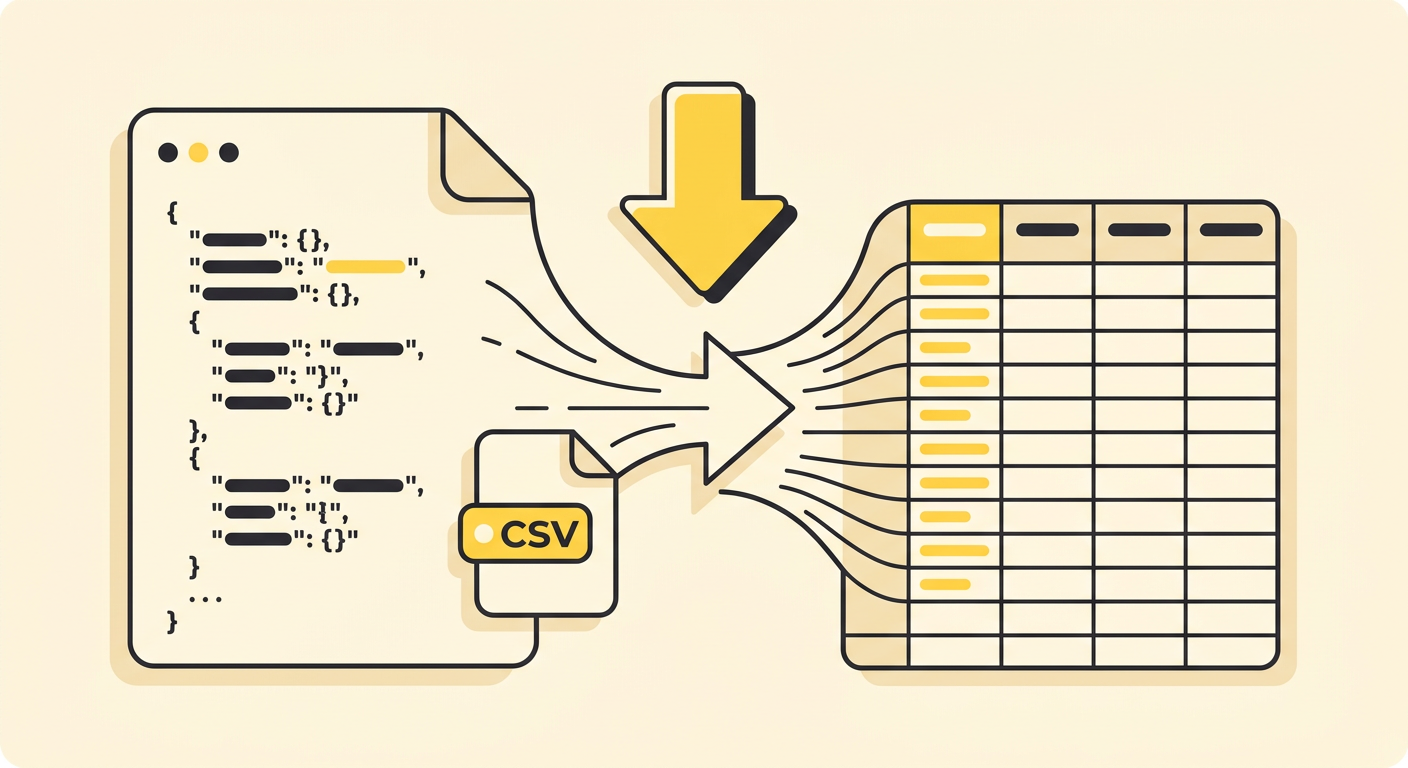
Numbers locked in a dashboard are only half useful. Pull delivery stats through the API, get events pushed to you the second they happen, or export any chart to CSV for the spreadsheet crowd.
Create your account and watch your first delivery stats roll in within minutes. No sales call, no fine print.
 PostedApi